Accelerating Innovation While Maintaining Quality: A Guide to Shelf-Life Testing

In today's fast-paced food industry, speed and innovation are paramount for companies aiming to capture market share. However, achieving "first-to-market" status shouldn't compromise total quality. Consumer perception is the ultimate measure of quality, and this must be maintained throughout the product lifecycle—from development and production to distribution and consumption.
This post explores the crucial role of shelf-life testing in balancing speed and quality, focusing on the impact of moisture and water activity.
Shelf Life Testing
Our knowledge and experience help your brand deliver the ideal consumer experience every time. Contact us to learn about our pragmatic solutions for shelf-life testing.
Contact UsThe Importance of Shelf-Life Studies in a Fast-Paced Market
While lengthy shelf-life studies might seem at odds with the need for speed, accelerated testing methods allow for efficient quality assessment. Understanding the mechanisms of food deterioration—the effects of temperature, water activity, and other factors—is key to developing effective accelerated shelf-life studies.
For example, a breakfast cereal's crispness is maintained in a low-humidity environment (like a Minnesota winter with relative humidity below 25%). However, flavor and susceptibility to insect infestation can still change. Shelf-life studies help predict how long a product will maintain its quality under various conditions.
Key Mechanisms of Processed Food Deterioration
The primary causes of processed food deterioration include:
- Microbiological spoilage: Growth of spoilage microorganisms and potentially harmful pathogens.
- Chemical and enzymatic activity: Lipid breakdown, leading to changes in color, odor, flavor, and texture.
- Moisture migration: Changes in texture, water activity, and flavor due to moisture gain or loss.
These mechanisms are influenced by various factors controllable through formulation and processing:
- Moisture and water activity
- pH
- Heat treatments
- Emulsifier systems
- Preservatives and additives
- Packaging
The Critical Role of Moisture and Water Activity
Water is essential for microbial growth and many chemical reactions in food. It exists in two forms:
- Free water: Available for chemical reactions, microbial growth, and compound transport.
- Bound water: Tied up by water-soluble compounds (sugars, salts, gums) or the food matrix, unavailable for reactions.
Raoult's Law describes how water-binding reduces water vapor pressure. The ratio of this vapor pressure to that of pure water is water activity (aw). Pure water has aw = 1. A saturated sodium chloride solution has aw of approximately 0.75.
Equilibrium Relative Humidity (ERH): This is the relative humidity at which a food neither gains nor loses moisture. It's directly related to water activity: aw = ERH/100. Understanding ERH is crucial for packaging design and predicting product stability during distribution.
Equilibrium Moisture and Sorption Isotherms
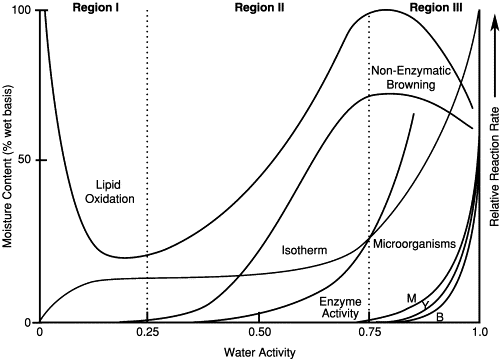
When exposed to constant humidity, food reaches an equilibrium moisture content. Plotting equilibrium moisture content against relative humidity (or water activity) creates a moisture sorption isotherm. This graph reveals how moisture content affects product stability and the risk of microbial growth at different water activities. For example, a cereal might remain crisp at a low aw but become moldy at a higher aw.
Table 1: The Effect of Relative Humidity on Moisture Content And Texture of Breakfast Cereal (Initial Conditions: 2.5%)
| % Relative Humidity | % H2O | Texture |
| 0.0 | 1.54 | Crisp |
| 11.1 | 2.27 | Crisp |
| 22.9 | 3.18 | Crisp |
| 32.9 | 4.59 | Soft |
| 43.9 | 6.55 | Soggy |
| 53.5 | 8.27 | Soggy |
| 64.8 | 11.43 | Rubbery |
| 75.5 | 15.88 | Moldy |
| 86.5 | 23.69 | Moldy |
Table 2: The Effect of Relative Humidity on Moisture Content And Texture of Flour (Initial Conditions: 12.0%)
| % RH | % H2O |
|---|---|
| 0.0 | 0.53 |
| 11.1 | 5.90 |
| 22.9 | 7.65 |
| 32.9 | 8.95 |
| 43.9 | 10.11 |
| 53.5 | 10.9 |
| 64.8 | 12.21 |
| 75.5 | 15.68 |
| 86.5 | 18.80 |
Figure 1. Stability map of food as a function of water activity

Testing Equilibrium Moisture Effects: The "Weather Room" Method
Changes in moisture content during distribution can significantly impact product quality. The rate of moisture change can be monitored by tracking package weight changes under controlled temperature and humidity conditions.
Medallion Labs uses a "weather room" (65% RH, temperature cycling between 74°F and 90°F) to simulate hot, humid conditions. Weekly weight measurements, combined with initial moisture content and packaging WVTR (Water Vapor Transmission Rate), help determine shelf life. This method is particularly useful for detecting small moisture changes due to packaging imperfections.
It is difficult to obtain reliable weight change data on packages at relative humidities above 75%. Most food packages contain paper or paperboard which gains and loses moisture in the same manner as food products. When stored at a relative humidity about 75%, the amount of water gained in the paper component is large and moisture condensation can become a problem.
To obtain reliable results, there are some prerequisites:
- Initial product moistures must all be the same in each set
- Sealed empty packages must be used as controls
- The heat and humidity at the storage conditions should not result in weight changes other than from moisture, i.e., no chemical changes in leavening systems
- The weight variation of the packages must be small with respect to net product weight. A rule of thumb is that the weight difference between the heaviest and lightest empty packages divided by the average net weight of the product must equal 0.025 or less
If moisture gain or loss is extremely important to the packaged food product, this method may be able to help you with shelf life questions.
Shelf Life Considerations: Microbiology, Chemical Deterioration, and the Q10 Concept
Microbiology: The shelf life of refrigerated products is primarily determined by microbial growth. Controlling moisture, pH, temperature, and nutrients prevents microbial spoilage and pathogen growth. Real-time microbiological testing provides accurate shelf-life estimations.
Chemical Deterioration: This involves lipid oxidation, enzymatic degradation, and non-enzymatic browning. These processes are accelerated by higher temperatures.
Lipid Oxidation: This occurs through free radical reactions, lipoxygenase activity, and photo-oxidation. Monitoring peroxide values, aldehydes (like n-hexanal), and free fatty acids helps track oxidative rancidity.
Kinetics of Shelf-Life Testing: Shelf-life prediction uses principles of chemical reaction kinetics. The relationship between a measurable quality parameter and time should be linear for accurate prediction. Zero-order, first-order, and second-order reactions are common in food systems.
Q10: This represents the increase in reaction rate for a 10°C temperature increase. It's crucial for extrapolating shelf life from accelerated tests to typical storage temperatures. A small difference in Q10 can significantly affect shelf-life projections.
Table 3: Food Deterioration Activation Energies
| Reactive Activation Energy | Kcal/mol |
|---|---|
| Oxidative Rancidity | 10-25 |
| Enzyme Reactions | 10-30 |
| Vitamin Losses | 20-30 |
| Non-Enzymatic Browning | 25-50 |
Table 4: Storage Week Equivalents for Various Q10 Values
| Q10 | 1 Week @ 100°F = This Number of Weeks @ 70°F |
|---|---|
| 1.5 | 2.0 |
| 2.0 | 3.2 |
| 2.5 | 4.6 |
| 3.0 | 6.2 |
| 4.0 | 10.1 |
| 5.0 | 14.6 |
Designing Effective Shelf-Life Studies
- Select a Degradation Indicator: Choose a measurable quality parameter (lipid oxidation, vitamin loss, moisture change) relevant to the product.
- Choose Packaging: Use the intended packaging to obtain realistic shelf-life data.
- Select Storage Temperatures: Use at least two temperatures (ideally three or four) to allow for accurate Q10 calculation.
- Determine Testing Frequency: Use Labuza's equation or adjust based on observed degradation rates.
- Ensure Statistical Reliability: Obtain at least six data points per temperature.
- Document Thoroughly: Maintain detailed records for future analysis and comparison.
By understanding and applying these principles, food companies can effectively balance speed and innovation with the assurance of delivering high-quality products with extended shelf life. Contact us to learn more about our shelf-life testing services.
Let's Get to Work!
Submit your order online and ship your samples today. If you have questions, we are always here to help.
Medallion Labs+
A food testing program designed with mid-market and enterprise food and ingredient manufacturers in mind.
- Figure 1: Labuza, T.P., 1970, Properties of Water as Related to the Keeping Quality of Foods, Proceedings of the Third International Congress on Food Science & Technology, pp. 618, Institute of Food Technologists, Chicago, IL
- Table 1: Fritsch, C.W., 1987, Evaluation of Moisture Protection, Internal Correspondence
- Table 2: Fritsch, C.W., 1987, Shelf-Life Info, Internal Correspondence
- Hamilton, R.J., 1989, Rancidity in Foods, p. 13, Elsevier Applied Science, New York, NY
- Fritsch, C.W. and Gale, J., 1977, Hexanal as a Measure of Rancidity in Low Fat Foods, JAOCS, 54, pp. 225
- Labuza, T.P., 1979, A Theoretical Comparison of Losses in Foods Under Fluctuating Temperature Sequences, J of Food Sci., 44, pp. 1162
- Labuza, T.P., 1985, An Integrated Approach to Food Chemistry: Illustrative Cases, p. 923, Chapter 16 in further reading Reference 3 above.